Friday, March 29, 2013

BREAKING: New GAO Report on Racial/Ethnic Overrepresentation in Special Education

Government Accountability Office
Government Accountability Office (Photo credit: dcdan)


In breaking news, the Government Accountability Office has issued a report critical of the definitions states are allowed to use in determining whether racial or ethnic groups are overrepresented in special education. It has long been the contention of certain racial and ethnic groups that their kids are included in special ed in  disproportionate numbers.

In 2010, states required about 2 percent of all districts to use Individuals with Disabilities Education Act (IDEA) funds for early intervening services to address the overrepresentation of racial and ethnic groups in special education. Based on definitions states individually developed to measure this overrepresentation-- referred to in IDEA as significant disproportionality--356 districts were required to provide services. Half of these districts were clustered in five states and 73 were in Louisiana alone. States have used flexibility provided by Education to develop their own definitions of significant disproportionality and GAO's analysis of 16 selected states found wide variation in definitions. Further, GAO found that the way some states defined overrepresentation made it unlikely that any districts would be identified and thus required to provide early intervening services. Nebraska and Louisiana illustrate differing outcomes that can result from different state definitions. In Nebraska, one of 21 states that did not require any districts to provide services in 2010-11, racial and ethnic groups must be identified for special education at a rate three times higher than for other groups for 2 consecutive years. In contrast, racial and ethnic groups in Louisiana districts must be identified for special education at twice the rate of other students in any year. GAO's analysis found if Nebraska had used Louisiana's definition, Nebraska districts may have been required to provide services and, conversely, Louisiana might have identified fewer districts under Nebraska's definition.

The GAO recommends that states be required by the federal Department of Education to use a uniform definition.

You can see a summary of the report here. You can read the entire 44 page report here.

Enhanced by Zemanta

Saturday, March 23, 2013

Trainings of Dispute Resolution Professionals

The Supreme Administrative Court of Sweden in ...
The Supreme Administrative Court of Sweden in Stockholm is the highest administrative court in Sweden. (Photo credit: Wikipedia)


I love my job.  Because of it, I frequently get to speak at conferences and do trainings.  Special education law is a great field because it is constantly changing. As we have said here before special ed law is a lot closer to metaphysics than it is to contract law.  

I really enjoyed a training that I did last week.  It was for a state education agency and their administrative law judges,mediators and complaint investigators. I'm doing another ALJ training next week.  (In some states, we are called hearing officers.  In others we are called ALJs.) Although I am referred to as the "trainer," I always learn something from the participants.  The participants often are active during the session- asking questions and offering solutions that work for them.  Last week was no exception.

When I work with my fellow hearing officers, I am always impressed by the quality of their work and their dedication to their craft.    It is rewarding.

There have been many suggestions that the special education due process hearing system be gutted, or substantially changed.  What do you think?
Enhanced by Zemanta

Monday, March 18, 2013

Is Special Ed Creating Independent Adults - Part II

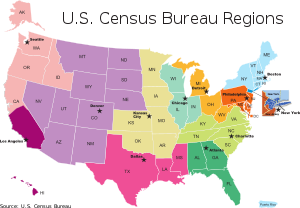
English: U.S. Census Bureau Regions, Partnersh...
English: U.S. Census Bureau Regions, Partnership and Data Services Program. A map of the US Census Bureau Regions. (Photo credit: Wikipedia)


In a recent post  we noted that about a third of adults receiving government assistance had disabilities of some type. This caused us to question whether transition in specific and special education in general were succeeding with respect to the goal of creating independent adults.

Well last week our friends at the U S Census Bureau provided more numbers to cause us to repeat these questions. They have released the Disability Employment Tabulation which has a wealth of statistical information about people with disabilities in the workforce.  You can review the deep well of information  on the Disability Employment Tabulation through this link.

Here is a small sample of the in formation available:

Between 2008 and 2010, individuals without disabilities were about three times more likely to be employed than individuals with disabilities. Overall, individuals with disabilities accounted for 9.4 million, or 6.0 percent, of the 155.9 million civilian labor force. 

More than half of all workers with a disability were concentrated in four general occupation groups: service workers (except protective services) with 18.2 percent, followed by administrative support (15.1 percent), sales workers (10.4 percent) and management, business and finance (8.9 percent).

Among specific occupations, janitors and building cleaners had the highest number of employees with a disability at 315,000, or 11.8 percent of all workers in that field, followed by drivers/sales workers and truck drivers with 263,000 people, cashiers with 256,000 and retail salespeople with 223,000.

Among occupations with 100,000 or more people, dishwashers had the highest disability rate at 14.3 percent, followed by refuse and recyclable material collectors (12.7 percent), personal care aides (11.9 percent), and janitors and building cleaners (11.8 percent). The rates for refuse and recyclable material collectors, personal care aides, and janitors and building cleaners were not statistically different from one another. 

More than half of workers with disabilities (52 percent) earned less than $25,000 in the previous year, compared with just 38 percent of workers with no disabilities. This translates into an earnings gap where individuals with disabilities earn about 75 percent of what workers without disabilities earn.

Overall, janitors and building cleaners were among the most common occupations for individuals with a disability for non-Hispanic whites (184,000 people), non-Hispanic blacks (60,000) and Hispanics (54,000).
Individuals with disabilities accounted for 6.3 percent of the male civilian labor force and 5.7 percent of the female civilian labor force.

The three most common occupations for men with disabilities were drivers/sales workers and truck drivers (246,000); janitors and building cleaners (217,000); and laborers and freight, stock, and material movers (171,000). For women, they were cashiers (195,000); secretaries and administrative assistants (189,000); and nursing, psychiatric and home health aides (172,000). The number of male laborers and freight, stock, and material movers was not significantly different from the number of female nursing, psychiatric and home health aides.

Any thoughts?


Enhanced by Zemanta

Wednesday, March 13, 2013

Harkin Amendment Would Blunt Sequester Cuts to Special Ed

Senator Tom Harkin of Iowa
Senator Tom Harkin of Iowa (Photo credit: Wikipedia)


Senator Tom Harkin has introduced an amendment to HR 933 that would mitigate the effects of the sequester in special education.  Here is a summary of the amendment.

If you are concerned about the sequester and its effect upon the education of children with disabilities, you should contact your Senators and representatives and ask them to vote for the amendment.  Our friends at the Council for Exceptional Children have established this tool to make it very easy to effectively contact your senators about this issue. You should personalize your message to reflect your feelings.

So what do you think about this Amendment?
Enhanced by Zemanta

Wednesday, March 6, 2013

Is Special Ed Making Independent Adults? New Study By Census Bureau

English: Seal of the United States Census Bure...
English: Seal of the United States Census Bureau.  (Photo credit: Wikipedia)


According to the Census Bureau, among the 46.0 million adults who received income-based government assistance in 2011, 30.4 percent of them had a disability.  The report issued last month is entitled Disability Characteristics of Income-Based Government Assistance Recipients in the United States: 2011

“On average, people with disabilities have lower employment and earnings; therefore, understanding what assistance people with disabilities receive may help governments better coordinate and administer their programs,” said Bernice Boursiquot, a Census Bureau statistician and co-author of the report.

States west of the Appalachian Mountains had higher rates of disability among recipients of income-based assistance. In comparison, states in the Southwest and along the Eastern Seaboard had lower rates.  West Virginia, Kentucky and Arkansas were three of the top five states for disability prevalence in the total population, as well as in the total population receiving government assistance. In West Virginia, 26.8 percent of people with disabilities reported having ambulatory difficulty, defined as severe difficulties walking or climbing stairs. 

You can view the entire report here.

One question for special education: how does this reflect on IDEA transition programs?  Is special education succeeding in making people with disabilities more independent?  Your thoughts?


Enhanced by Zemanta

Friday, March 1, 2013

Sequestration Will Hurt Kids With Disabilities

English: View of Capitol Hill from the U.S. Su...
English: View of Capitol Hill from the U.S. Supreme Court Česky: Pohled na Kapitol z budovy Nejvyššího soudu Spojených států (Photo credit: Wikipedia)


Sequestration starts today unless the Congress acts.  It will hurt the education of children with disabilities!

How will IDEA be affected? Under sequestration, federal funding for the Individuals with Disabilities Education Act will be reduced by $1,053,600,000 in 2013, or 28 percent of the total reduction to education programs. 

You can view an analysis and explanation by our friends at IDEA money watch here.

You can see the amount of money that your state  and the projected number of special ed staff will lose on this chart.

Now would be a good time to call your congressmen and senators and tell them to fix this.
Enhanced by Zemanta